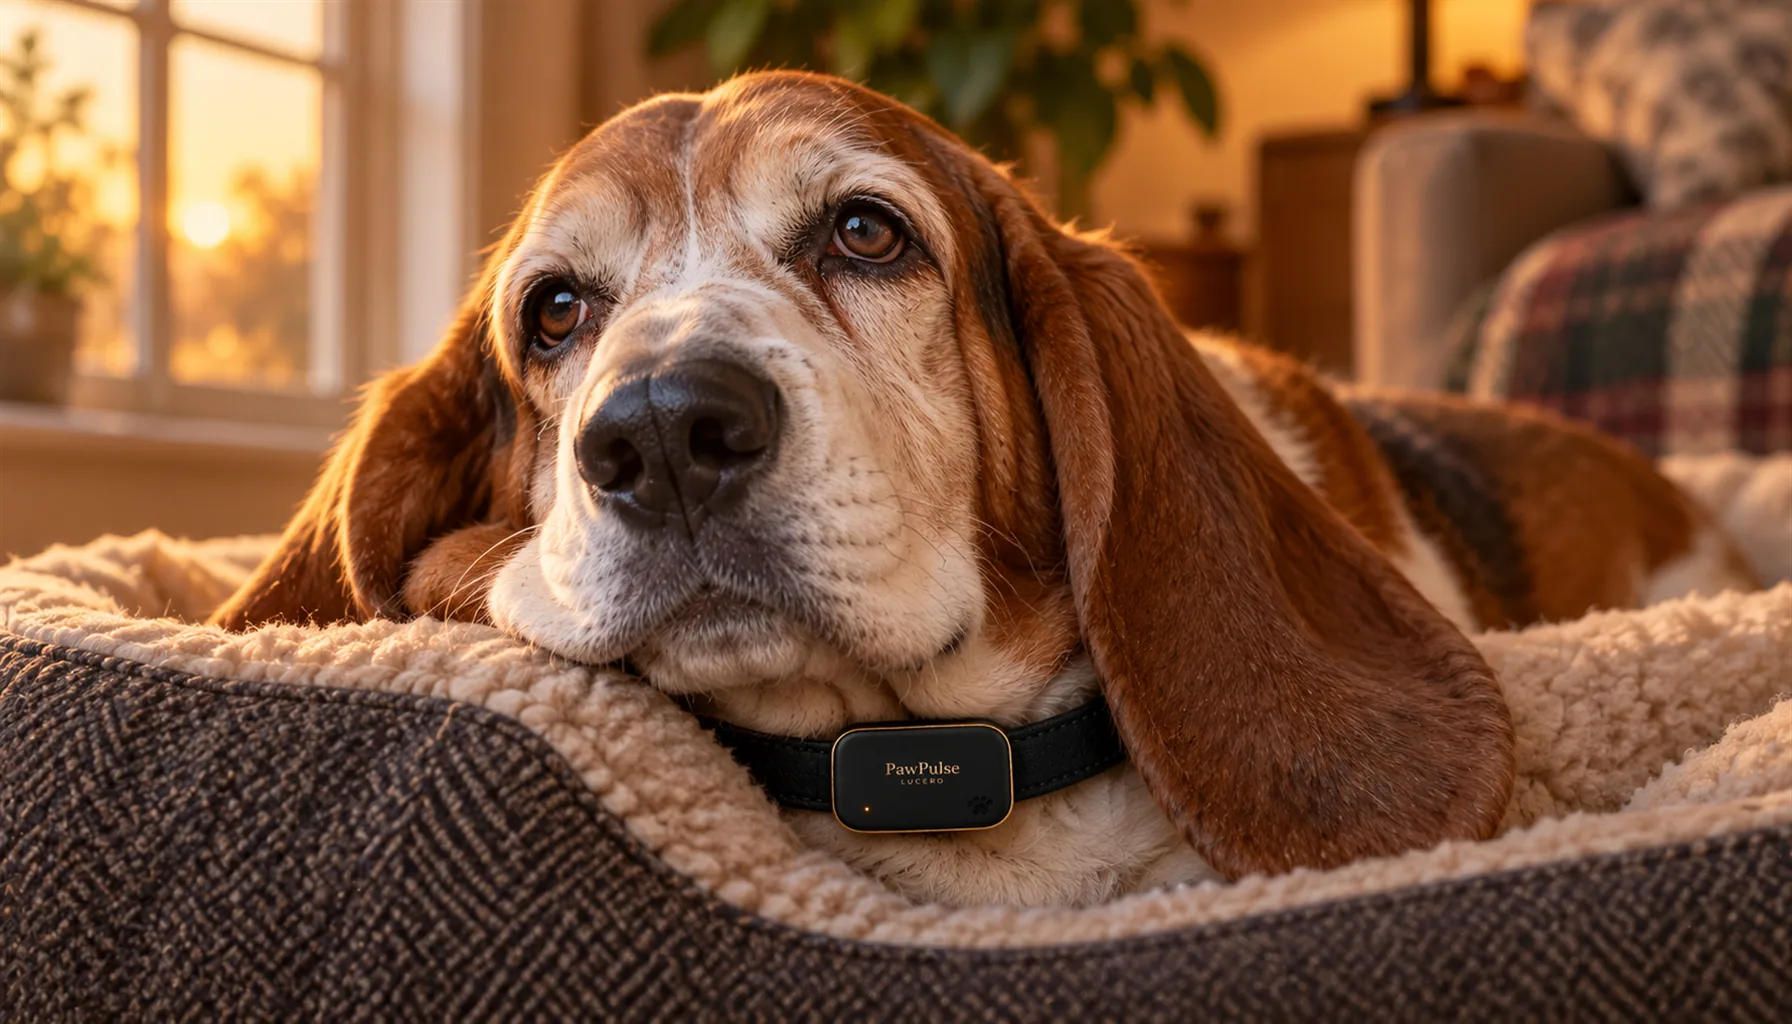
Key takeaway: A standard vet exam lasts 15-20 minutes and captures vitals at a single moment - often skewed by clinic stress. Conditions like early cardiac changes, chronic pain, and metabolic disease develop over weeks between visits. PawPulse's Vet Dashboard is designed to give veterinarians continuous home-collected data - heart rate trends, HRV, respiratory rate, sleep, and activity - all compared against each pet's individual baseline.
15 Minutes, Once a Year
Your vet is great at their job. In a 15-minute exam, they assess weight, body condition, dental health, cardiac sounds, respiratory function, abdominal palpation, joint mobility, skin condition, and neurological response. They ask about appetite, energy, behavior, and bathroom habits. That is an incredible amount of clinical assessment packed into a short window.
And it is still just a snapshot.
The challenge is not your vet's skill. It is the setup. A study in the Journal of Veterinary Behavior found that a third of dogs had heart rates spike above 180 BPM during their exam - not from cardiac disease, but from stress. Vitals measured in the clinic reflect the clinic experience, not how your pet actually is at home.
Meanwhile, the conditions that develop between annual visits - early kidney changes, creeping cardiac strain, gradual arthritis, chronic stress - move on a timeline measured in weeks. They are invisible during a single 15-minute window, and they are invisible to you watching day-to-day changes too slowly to notice.
That visibility gap is exactly what PawPulse is designed to fill.
The Difference Between a Snapshot and a Story
There is a huge difference between what a physical exam can reveal and what weeks of continuous data reveal.
| The Question | What a 15-Minute Exam Shows | What Continuous Data Shows |
|---|
| Is resting heart rate elevated? | Clinic reading (stress-inflated) | True resting HR from sleep data at home |
| Is HRV declining? | Not measurable in a standard exam | Daily HRV trend over weeks |
| When did symptoms actually start? | Owner's best guess ("maybe 2 weeks?") | Exact date the numbers shifted |
| How is post-surgery recovery going? | Point-in-time check | Full 14-day recovery curve (HR, activity, sleep) |
| Is chronic pain getting worse? | Behavioral observation during exam | Activity decline, sleep fragmentation, HRV changes over weeks |
| Is the medication working? | Owner's gut feeling | Before-and-after baseline comparison with real numbers |
The left column is what vets work with today. The right column is what PawPulse's Vet Dashboard is designed to provide.
How the Vet Dashboard Is Built to Work
The Vet Dashboard is not a consumer fitness app dressed up for clinics. It is being built as a clinic-ready timeline designed around how veterinarians actually work.
You Control Who Sees the Data
The pet owner authorizes vet access through the PawPulse app. You choose which veterinary practice gets to view your pet's data, and you can pull that access at any time. Your pet's data belongs to you.
Your Vet Gets a Health Timeline
When authorized, the veterinarian sees a longitudinal health timeline for your pet. The dashboard is designed to show:
Baseline comparisons. Not just today's numbers, but how today stacks up against your pet's established personal normal. Prism AI builds this baseline from weeks of continuous data, so deviations get flagged automatically against what is normal for your specific pet.
Anomaly markers. The dashboard highlights when metrics drifted outside the baseline range, for how long, and which metrics moved together. A vet seeing "heart rate elevated starting Tuesday, sustained for 5 days, with activity declining at the same time" has a real starting point.
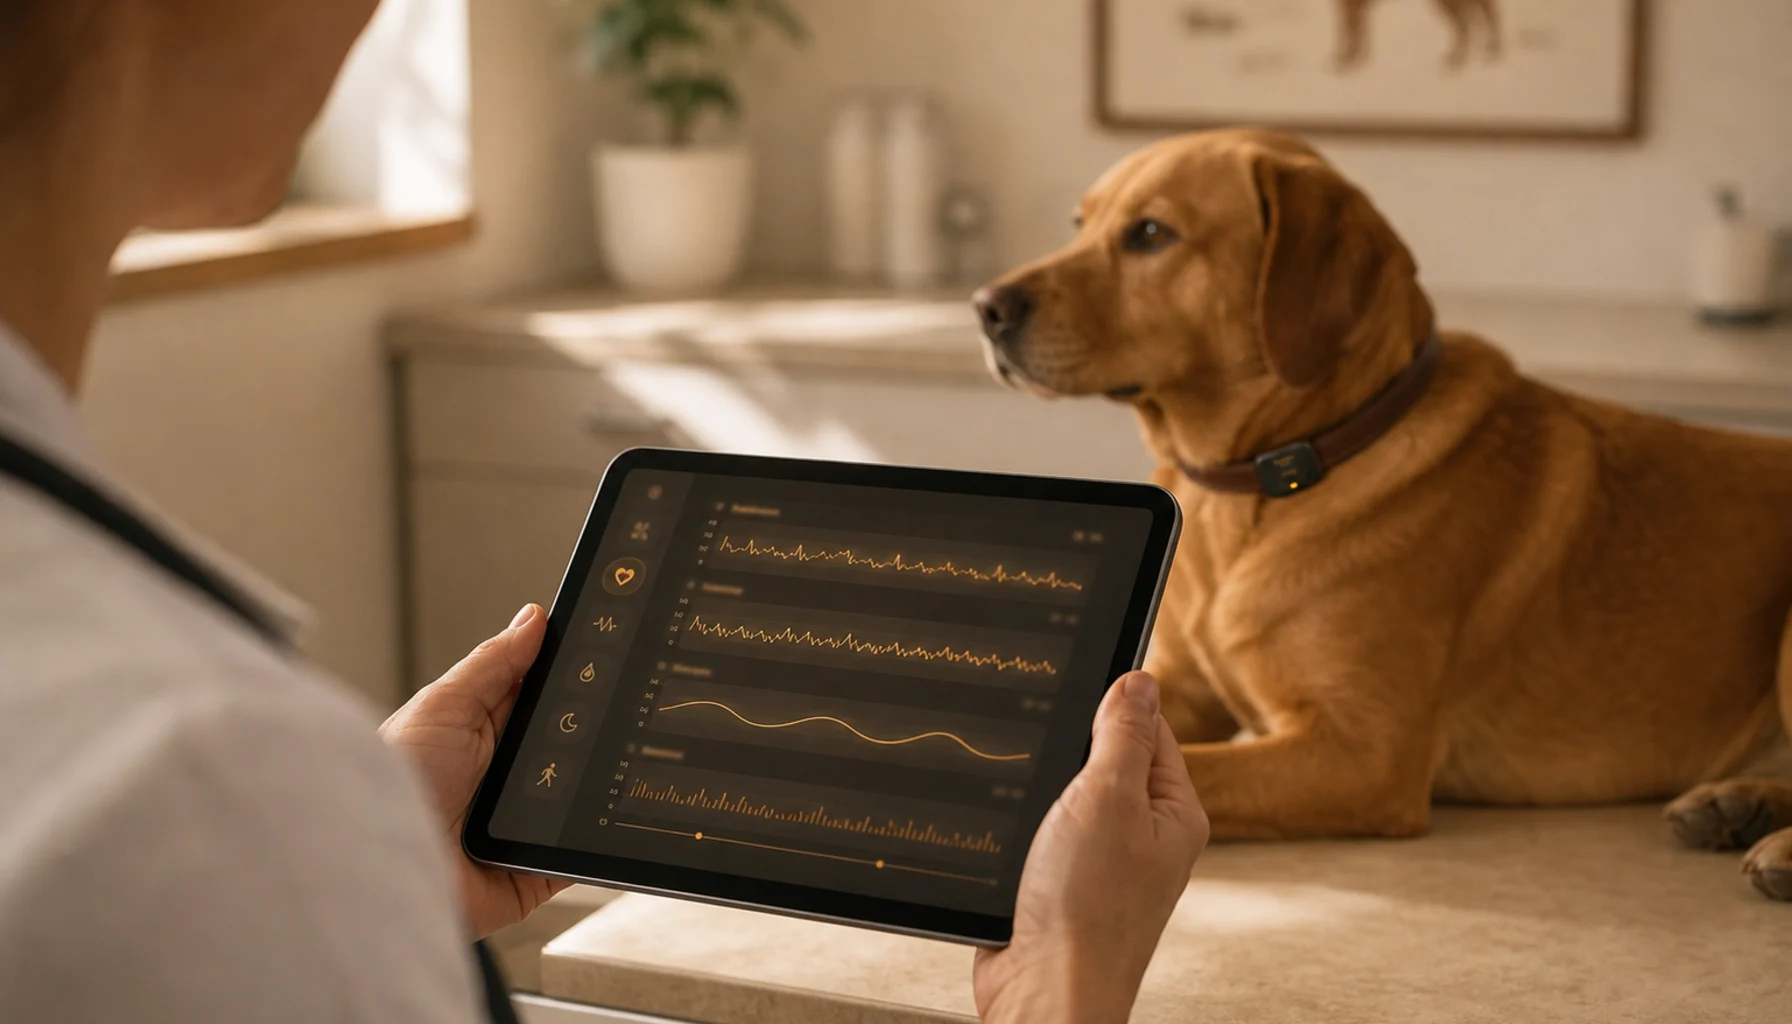
Everything at a glance. Heart rate, HRV, respiratory rate, sleep duration, sleep quality, and activity all show up together so the vet can spot correlated shifts instantly.
Exportable reports. Vets can pull a summary for the medical record, including trend graphs and key metrics. This becomes part of the patient file, and it gets more valuable with every visit.
The Data Shows Up Before the Dog Does
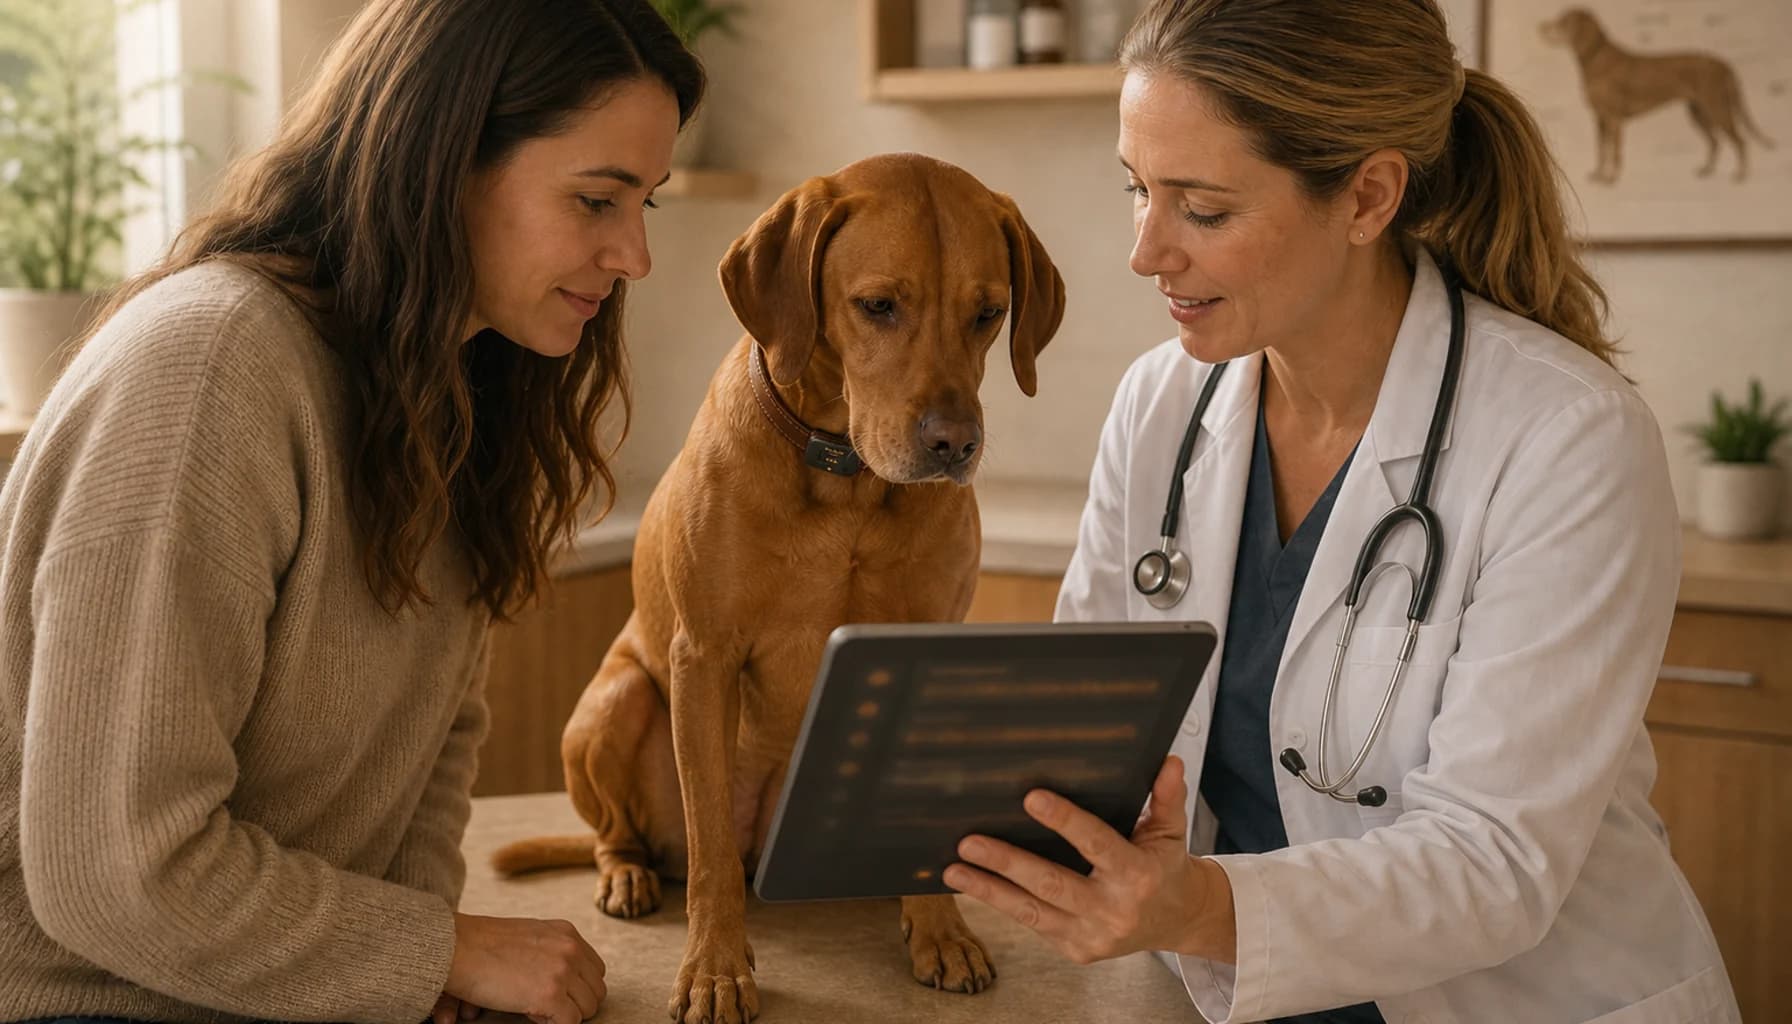
The most important design decision: the vet does not have to wait for the appointment. With dashboard access, they can review trends before your pet walks in, prepare targeted questions, and have a game plan for what to check.
This flips the exam from reactive ("so what has been going on?") to prepared ("I have been looking at the data, and I want to check cardiac function based on what I am seeing in the heart rate trend").
Three Real Scenarios Where This Changes the Outcome
The "He Just Seems Off" Visit
Without data: You tell the vet your dog has been sluggish for "a while." The vet orders a comprehensive blood panel, urinalysis, and possibly imaging to cast a wide net. Results take 1-3 days. Some tests come back normal because they were ordered to rule things out, not confirm a hunch.
With dashboard data: The vet sees resting heart rate trending up 12% over 9 days, HRV declining, sleep increasing, and activity dropping. The start date is clear. The correlated metrics point toward systemic rather than localized causes. The vet orders a focused panel targeting the most likely culprit. Faster answer, fewer unnecessary tests, lower bill.
The Post-Surgery Follow-Up
Without data: Recheck at day 14. You say "I think he is doing better." The vet checks the incision, listens to the heart, says "looks good." Standard recheck visit billed.
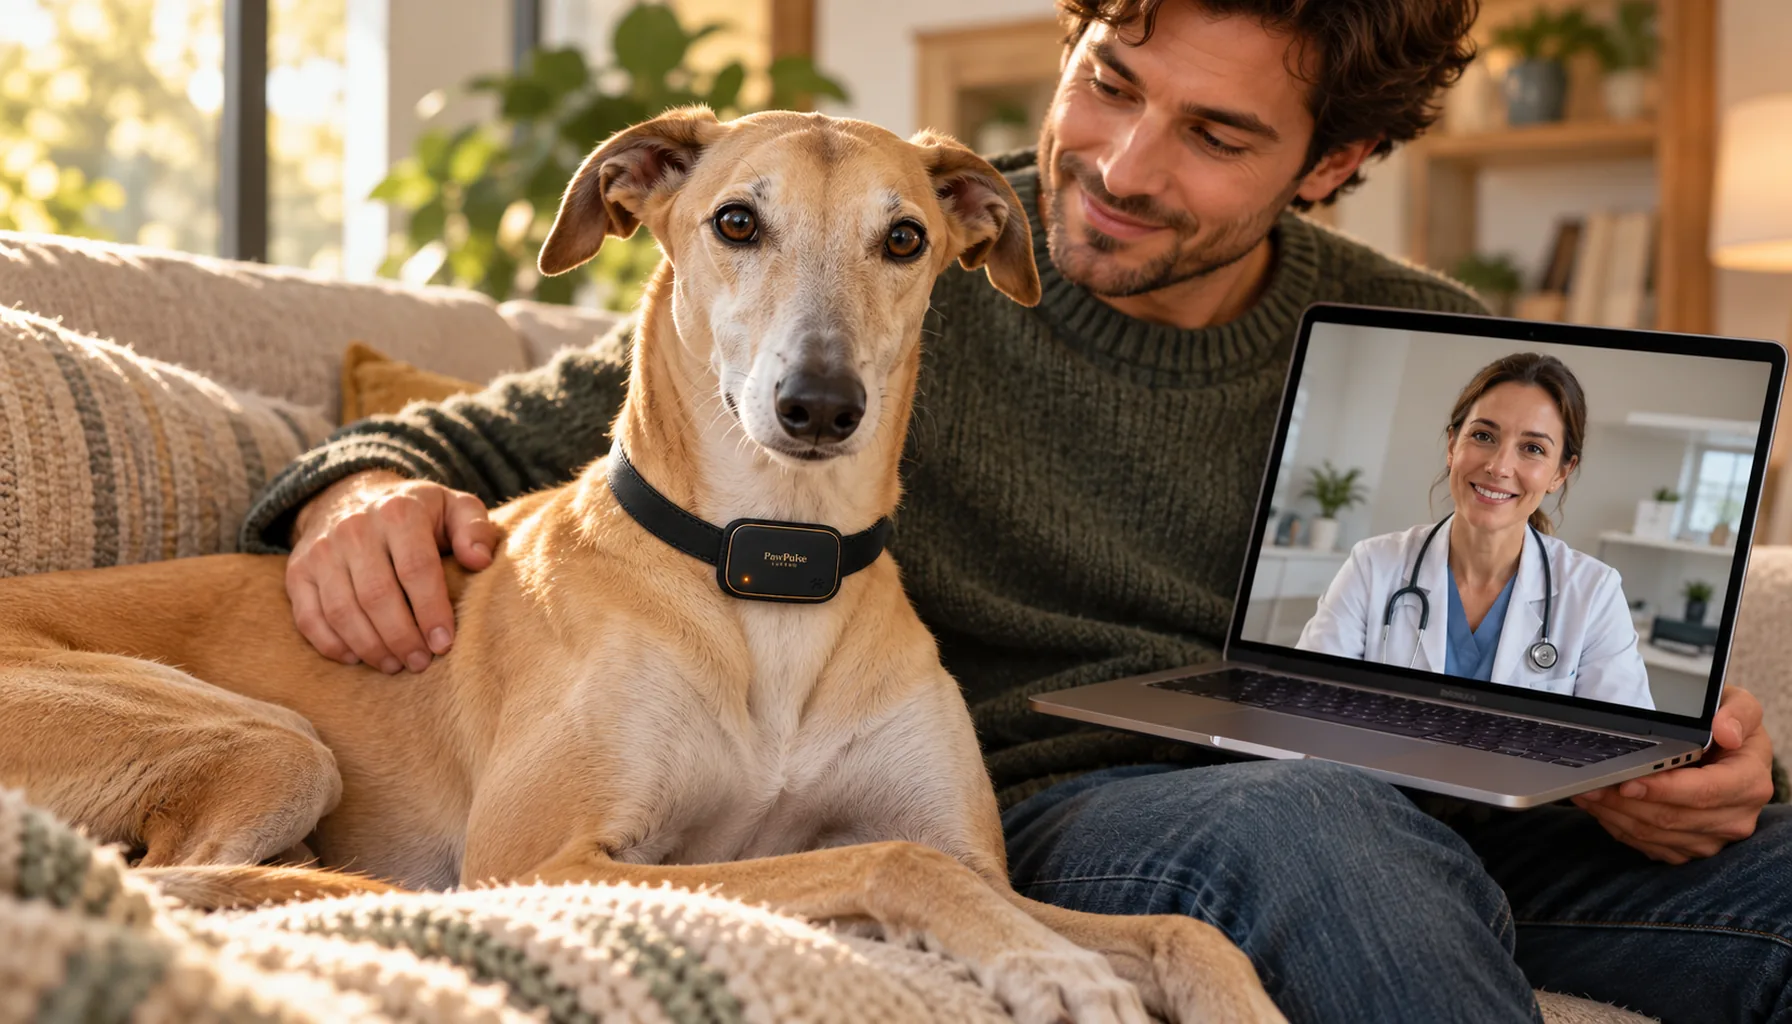
With dashboard data: The vet reviews the recovery curve remotely. Heart rate returned to baseline by day 10. Activity is rebuilding on schedule. Sleep quality normalized by day 8. No in-person visit needed. A 5-minute telehealth call confirms the data and clears the patient. You save the trip and the recheck fee.
The Chronic Condition Check-In
Without data: A dog on arthritis medication comes in every 3 months. The vet asks "how is he doing?" and you say "I think the meds are helping."
With dashboard data: The vet compares the last 3 months against the pre-medication baseline. Activity up 22%. Sleep fragmentation down 40%. HRV recovered 15%. The medication is working, and the numbers prove it. Or the opposite: activity and sleep have not budged, meaning the current dosage is not cutting it and needs adjustment. Either way, the vet has real evidence instead of a gut feeling.
What This Does for the Vet-Owner Relationship
Data does not replace the veterinarian. It makes them better at what they already do. A comprehensive review in Animals (MDPI) on remote vital sensing in veterinary medicine found that continuous monitoring can identify health problems in early stages while reducing stress for animal patients - validating exactly this kind of longitudinal data.
The most frustrating part of veterinary practice, according to the vets we have talked with, is making decisions based on incomplete information. "He has been off" tells the vet almost nothing. "His resting heart rate during sleep has been 15% above baseline for 8 days, with HRV declining and activity dropping" tells the vet exactly where to start.
PawPulse is designed to give vets the information they have always wanted but never had a practical way to collect. The Lucero collar runs passively, the AI handles the baseline and comparison work, and the dashboard presents it in a format built for clinical decision-making.
The vet still does the thinking. They just start from a much better place.
Frequently Asked Questions
What data does the PawPulse Vet Dashboard show?
The dashboard is designed to show continuous trends for heart rate, respiratory rate, heart rate variability (HRV), sleep duration and quality, and activity levels. Everything is compared against the individual pet's personal baseline built by Prism Insights. Anomaly markers highlight when and where metrics went outside normal range.
Do pet owners control which vets see their data?
Yes. You authorize vet access through the PawPulse app and can revoke it anytime. No data is shared without your explicit consent. The data belongs to you, the pet owner.
Can the Vet Dashboard replace an in-person exam?
No. The dashboard provides continuous health trend data that works alongside vet exams, not instead of them. It makes in-person visits more targeted and productive, and it can enable certain follow-ups (like post-surgery recovery checks) to happen via telehealth when the data supports it.
How does the dashboard help with chronic conditions?
For pets on long-term medication or managing chronic conditions like arthritis, cardiac issues, or kidney disease, the dashboard provides objective before-and-after data. Vets can compare pre-treatment baselines against post-treatment trends to see whether the medication or intervention is actually working - no more relying solely on "I think he seems better."
How does pricing work for the Vet Dashboard?
Dashboard access is designed to be included for partner clinics as part of the connected PawPulse platform. The monitoring capability comes with the Lucero collar's subscription. Our goal is to make adoption easy by keeping the data accessible and the interface built for clinical use.
Learn more about PawPulse Lucero and the PawPulse Vet Dashboard, built to give veterinarians the continuous data that 15-minute appointments just cannot capture.
-- The PawPulse Team